Accounting (MVA)

Volumes of production and injection are used to account for the CO2 volume stored at FWU.

The volume of CO2 that is purchased, flared, or recycled and reinjected are all known, so the volume stored can be calculated. To date, about 92% of the CO2 is in storage.


Cumulative (Top) and monthly (Bottom) volumes of CO2 use are shown below. All measurements are in metric tonnes.


MVA Map

MVA Map View – this figure shows some of the many types of monitoring in use at FWU. To date, no signs of leakage have been seen, and the greatest changes in CO2 flux in soil and atmospheric data appear more related to the seasonal agricultural land use.

Monitoring and Verification

As a demonstration project a comprehensive monitoring strategy is in place at FWU. This plan includes

Monitoring – understand CO2 plume movement over short and long time periods

  • Direct monitoring tests repeat air and water samples for seeps, leaks, and well-bore failure
  • Seismic MVA utilizes time lapse seismic data at a variety of scales to image the CO2 plume over time

Verification – assurance that CO2 stays in target reservoir, doesn’t make it back to atmosphere

Accounting – accurately measure amount of stored carbon including storage mechanisms


A variety of CO2 monitoring strategies are employed at FWU. Data collected from a variety of monitoring tools are examined on a frequent basis to ensure that no CO2 leakage is occurring.

Detecting CO2 at Surface:

  • Surface soil CO2 flux
  • Atmospheric CO2/CH4 eddy flux
  • Gas phase tracers

Detecting CO2 and/or other fluid migration in Target/Non-Target Reservoirs:

  • Groundwater chemistry (USDWs)
  • Water/gas phase tracers

Tracking CO2 Migration and Fate:

  • In situ pressure & temperature
  • 2D/3D seismic reflection surveys
  • VSP and Cross-well seismic
  • Passive seismic

Risk Assessment and Mitigation

Understanding the risks involved in a CCUS project and being prepared to mitigate any issue or action that may affect the project, the oilfield activities, or the longterm storage of CO2 is an important aspect of our Phase II activities. The Risk group conducts a number of activities. Each year the entire SWP team takes part in a risk assessment workshop, where risks that have been previously identified are ranked as to their likelihood and seriousness. Risk evaluation is an iterative task. New risks are added to the registry when they are identified, and response/mitigation is discussed as part of this workshop.

Simulation

Simulation is an integral part of studying CO2 injection, and is essential for making predictions of storage security, studying storage mechanisms, and understanding material balances

  • Simulation of production/storage history matching of primary, secondary, and tertiary recovery provides some calibration
  • Calibrated simulation used for predictions of future and CO2 storage in the reservoir;
  • Uncertainty estimates are critical for forecast context and risk assessment; relative permeability is paramount
  • Forecasting potential impacts (risk FEPs) via coupled thermal, geochemical and geomechanical processes;
  • Fully-coupled, full-scale simulations used to calibrate reduced order models for uncertainty quantification, risk assessment and optimization for ongoing forecasts.

Characterization: Role of Seismic Data

Seismic data has been an integral part of the characterization program and includes a baseline 42 mi2 3D survey over the entire field, three baseline 3D VSPS centered on injection wells and four baseline cross-well tomography segments between injector/producer pairs. In addition, a dedicated monitoring well has a 16 level 3 component passive seismic monitoring array installed within it.

Seismic interpretation has improved the geologic model and has revealed the presence of previously unknown features such as faults and channel-like features. It is important to understand the behavior of these features and their influence on fluid flow.


Additional seismic lines in the area include a 3D survey at the Booker field to the north, and some 2D lines that extend across a larger area. This geophysical data provides us with a greater understanding of the geological and tectonic evolution of the Anadarko basin.


Characterization

Characterization is an essential part of this study. A variety of techniques were used to analyze not only the reservoir rocks where the CO2 is injected and stored, but also the overlying caprock that helps to contain the CO2 . Three new wells were drilled and cored, providing us with physical samples and a modern suite of geophysical logs that could then be correlated with the many older logs available for other areas of the field. From this work we were able to develop a geological framework to better understand the deposition of the reservoir and caprock, relate this to various other reservoir properties such as porosity and permeability, and then build a model of the reservoir that could be used to simulate the complex movement of oil, brine, and CO2 in the reservoir.

Results of the characterization study have demonstrated a number of important points that have been detailed in many of the papers referenced in the bibliography

Some of the important points are:

  • The Morrow B reservoir, which is the target of the CO2 EOR project is a classic incised valley deposit typical of many Morrowan oil fields throughout the Anadarko Basin
  • The overlying Morrow shale makes an excellent caprock and seal, as does the Atokan Thirteen Finger Limestone.
  • A depositional model for the reservoir and caprock was refined through detailed core analysis and establishing wire-line log relationships across the field. The sediment package represents a transition from a fluvial system through to a more marine environment with the rhythmic facies transitions of the Thirteen Finger limestone representing high frequency cycles associated with the late Pennsylvanian climate.
  • Several faults have been interpreted from the 3D seismic data collected as part of this study. None are believed to be significant in terms of seal integrity or regional extent, but they do present some heterogeneity that must be accommodated in reservoir models.
  • Detailed analyses of core and log data has demonstrated that there are at least 8 distinct hydraulic flow units within the Morrow B that can be differentiated on the basis of porosity and permeability, ultimately tying back to variations in depositional and diagenetic processes.


Farnsworth Field

The area is located in a fully developed agricultural area with both dry and irrigated farming. Essentially 100% of the surface area has been cultivated for many decades. It is a sparsely populated area with about four farm/ranch residences scattered in the 20 square mile area and three small towns nearby. CO2 for the EOR project is sourced from 100% anthropogenic sources; the Arkalon Ethanol Plant in Kansas, and the Agrium Fertilizer Plant in Texas. Other CO2 EOR projects in the area include the Camrick and Booker Fields

Early Spring in Farnsworth Field


Phase III Project

The primary objective of this project has been to characterize and monitor the injection of ~1 million metric tons (tonnes) of

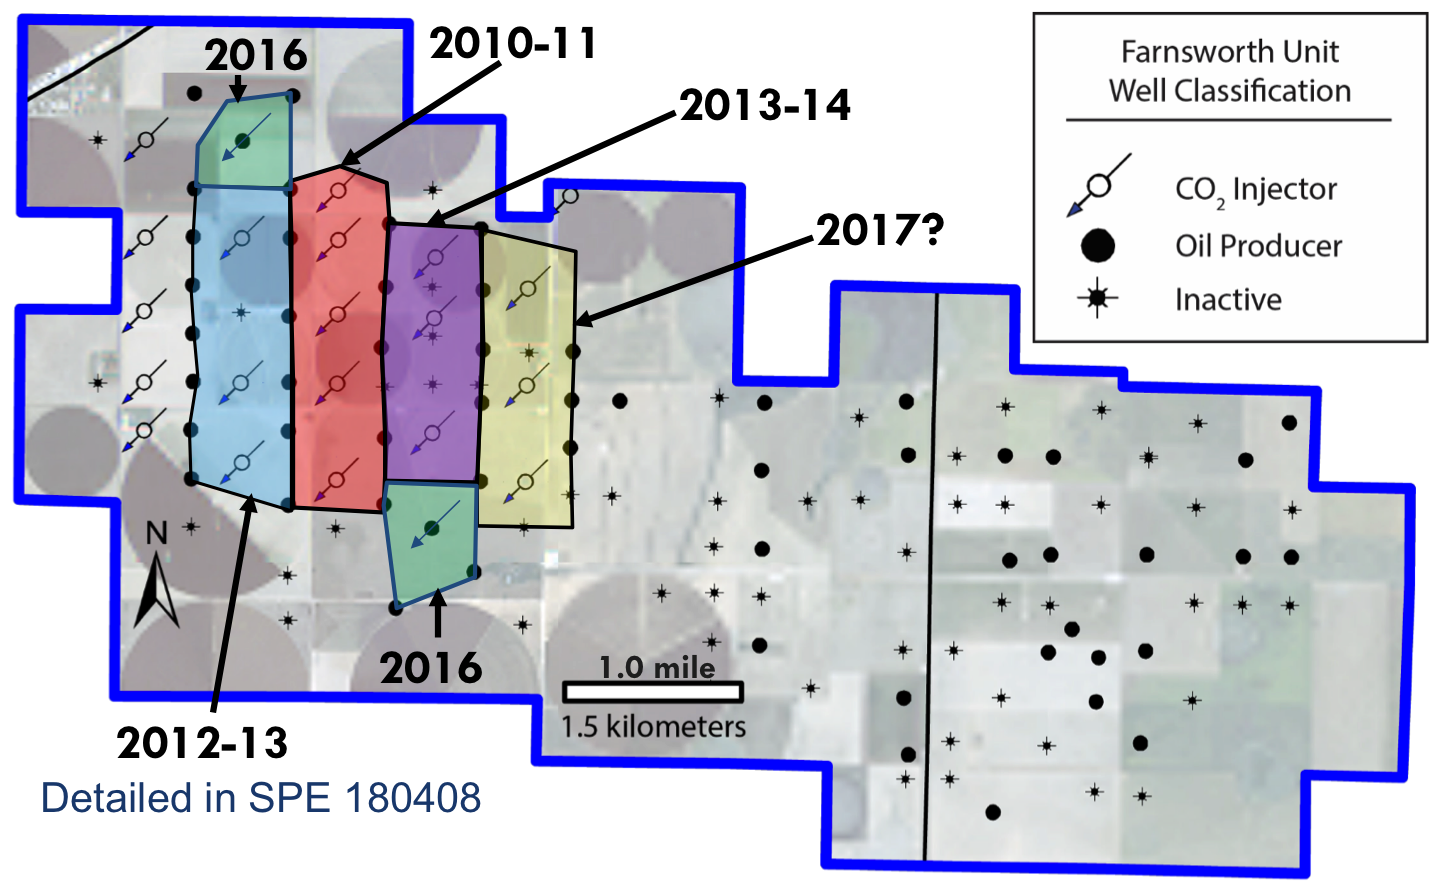
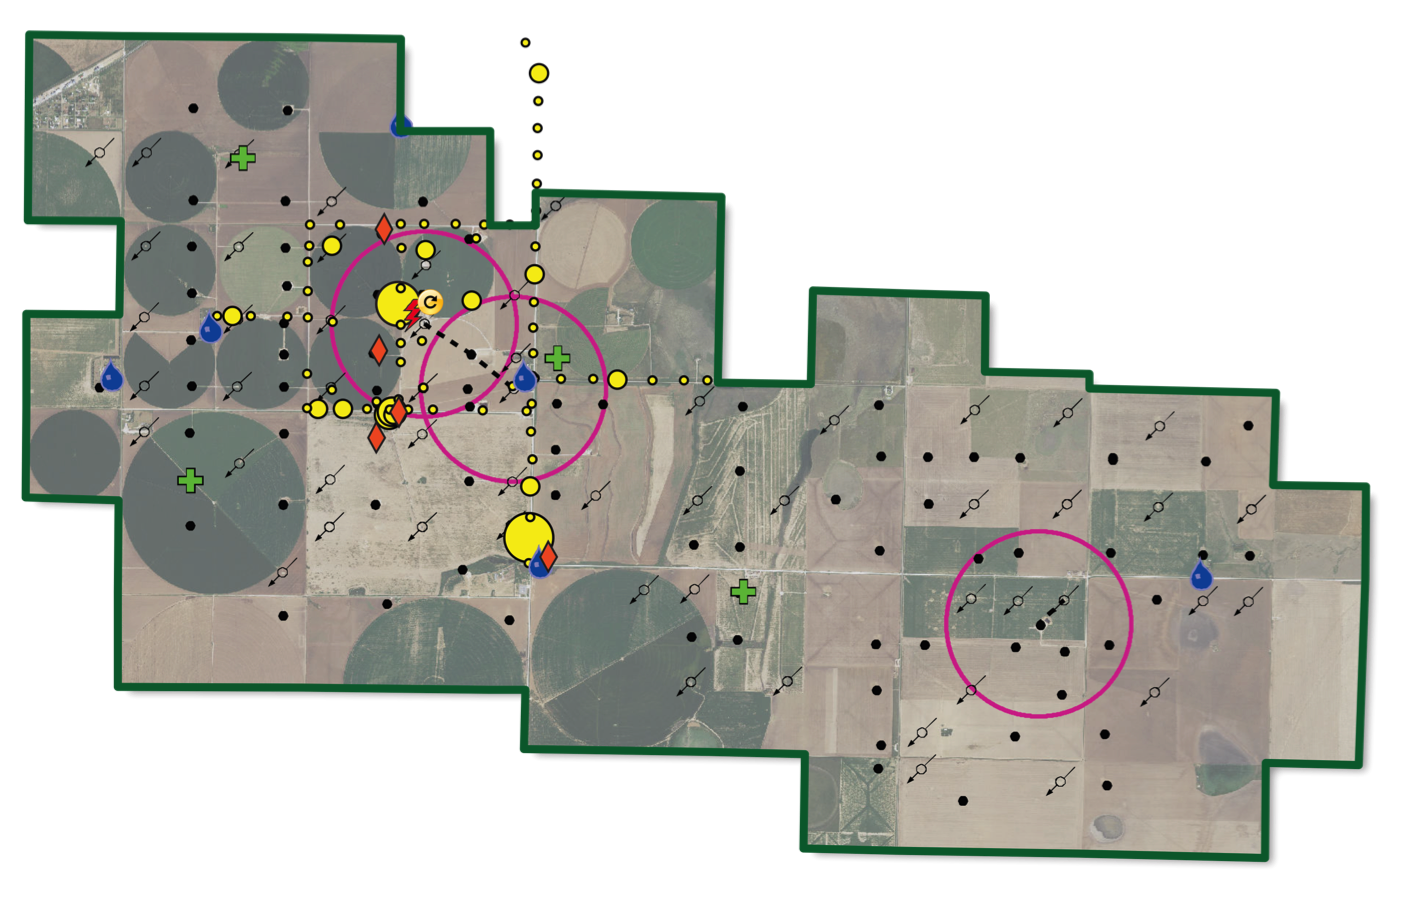
Farnsworth Oil Field showing existing wells and development plans. The phase III project has focused on the west side of the field which the operator believed was more amenable to the CO2 EOR project.

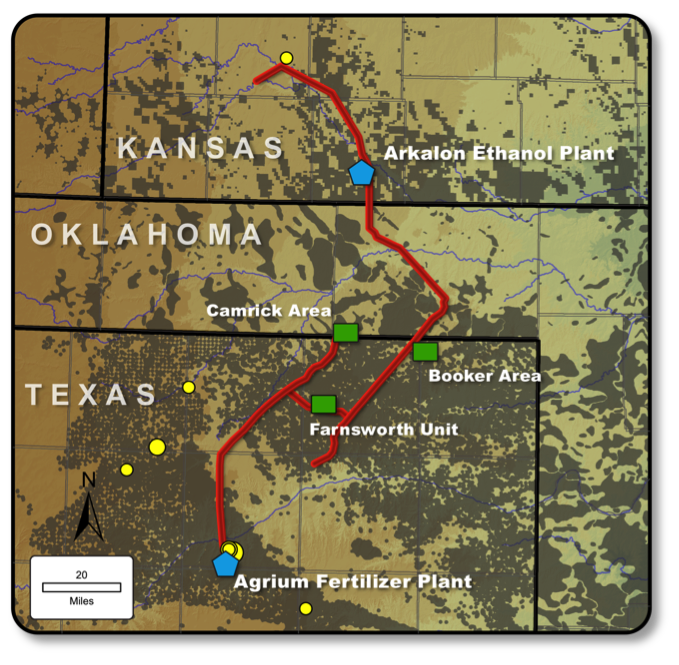
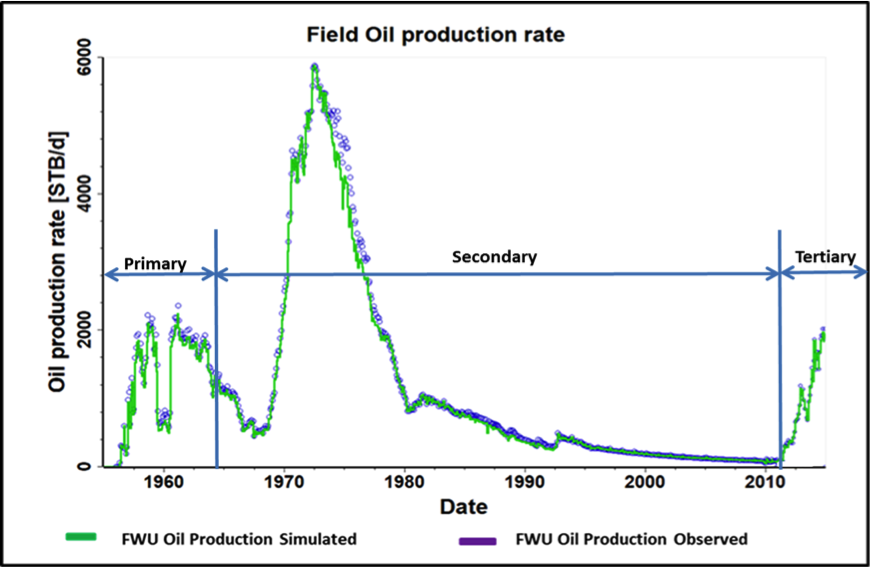
CO2 at Farnsworth Oil Field. At the proposed injection rate of 10 MMscf/d (~190,000 tonnes/yr), it will take approximately five years and four months to inject 1 million tonnes of CO2 into the target formation, the deep oil-bearing Morrow Formation in the FWU Area. All of the CO2 used at FWU is produced as a byproduct of industrial processes from nearby ethanol and fertilizer plants.

Chaparral LLC, the current field operator, is responsible for maintaining injection at the site, with its primary objective of optimizing the enhanced oil recovery effort. Chaparral has also helped SWP by facilitating the reservoir characterization, associated storage capacity evaluation and assessment of CO2 monitoring efficacy. SWP is also evaluating portability of results, and specifically applicability (transferability) of results with respect to other EOR fields. The FWU site is a unique opportunity for SWP to improve monitoring, verification and accounting (MVA) techniques during the project.

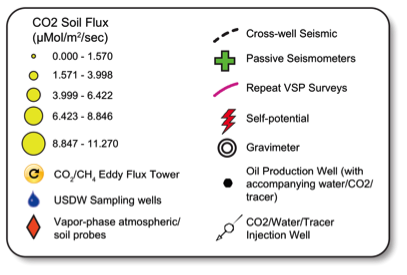
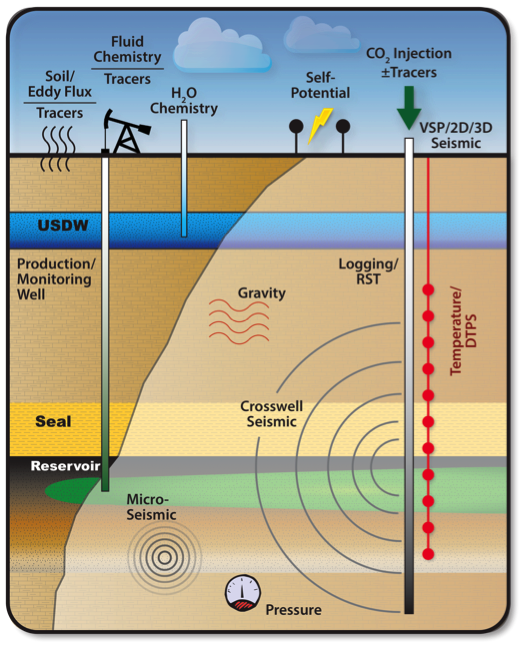
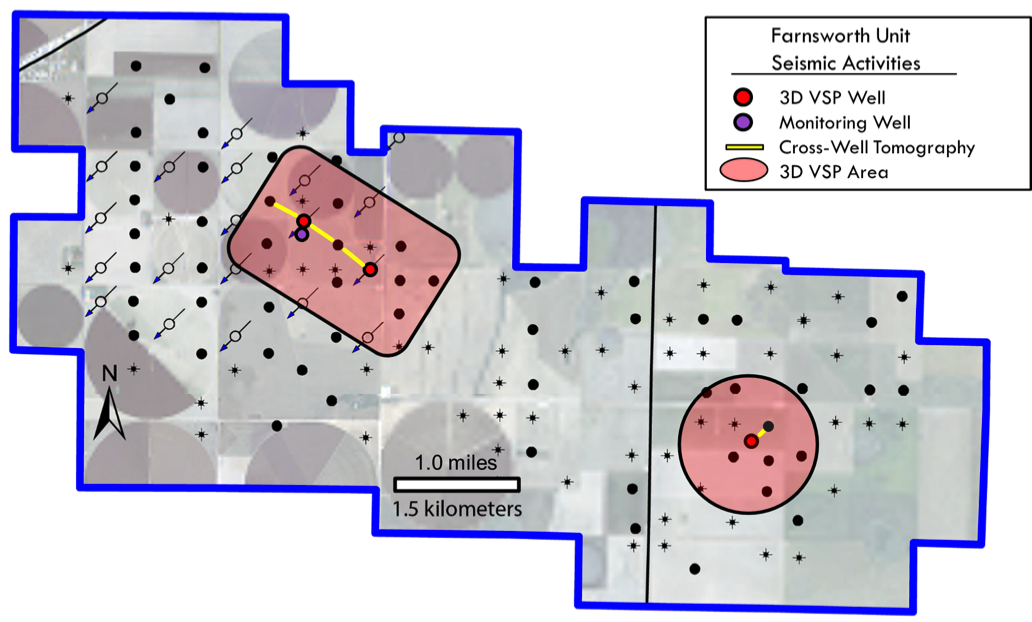
A variety of characterization, monitoring, and verification techniques have been used at FWU. Three wells have been drilled and cored in support of the characterization work. Seismic methods are emphasized, including 3D surface surveys (3D), 3D vertical seismic profiling (3D-VSP), and cross-well tomography (cross-well); passive seismic methods have also been employed to identify the size of the CO2 plume but have proven to be problematic in this area for a variety of reasons. Engineering and geochemical techniques such as analysis of injection rates, production well rates, as well as direct sampling of water, oil, and gas, use of introduced and/or natural tracers, groundwater chemistry monitoring, downhole pressure and temperature monitoring at injectors (at the surface) and production well locations (at the surface for flowing wells and downhole where applicable with electrical submersible pumps so equipped), soil gas sampling, and other methods as found applicable will also be employed.
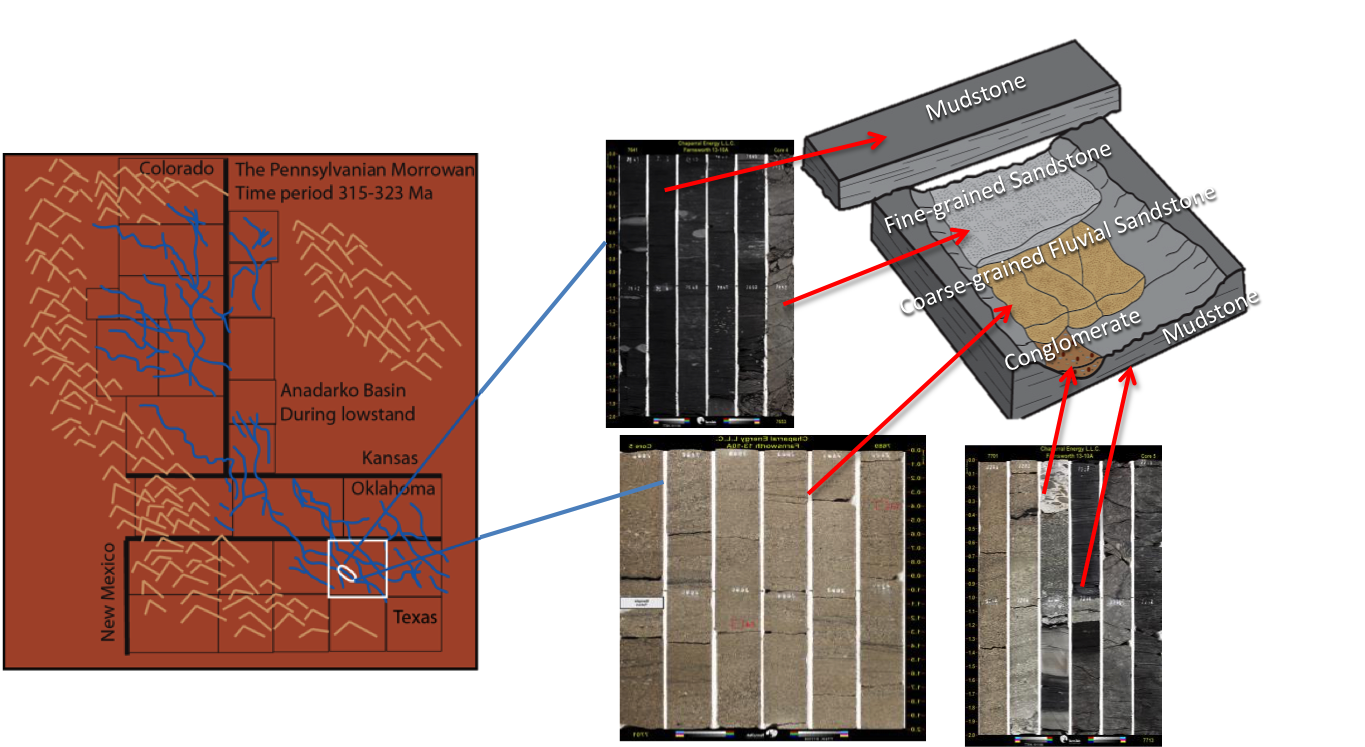
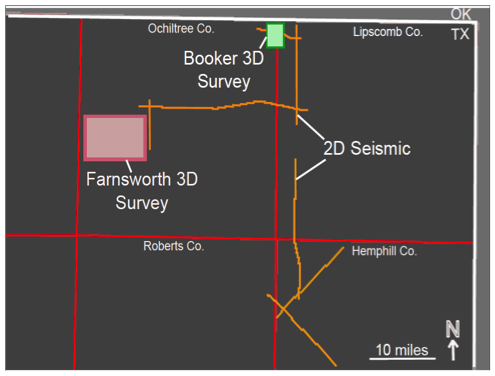